

WTAP Primary Antibody
Item Information
Catalog #
Size
Price
Description
The Wilms tumor suppressor gene WT1 appears to play a role in both transcriptional and posttranscriptional regulation of certain cellular genes. This gene encodes a WT1-associating protein, which is a ubiquitously expressed nuclear protein. Like WT1 protein, this protein is localized throughout the nucleoplasm as well as in speckles and partially colocalizes with splicing factors. Alternative splicing of this gene results in several transcript variants encoding three different isoforms.
Product Overview
Entrez GenelD
9589
Aliases
PNAS-132;hFL(2)D;KIAA0105
Clone#
6B6B6
Host / Isotype
Mouse / IgG1
Species Reactivity
Human, Monkey
Immunogen
Purified recombinant fragment of human WTAP (AA: 91-201) expressed in E. Coli.
Formulation
Purified antibody in PBS with 0.05% sodium azide
Storage
Store at 4°C short term. Aliquot and store at -20°C long term. Avoid freeze/thaw cycles.
Product Applications
WB (Western Blot)
1/500 - 1/2000
IHC_P(Immunohistochemistry)
1/200 - 1/1000
ICC (Immunocytochemistry)
1/200 - 1/1000
FCM (Flow Cytometry)
1/200 - 1/400
ELISA
1/10000
References
1.J Gastroenterol. 2013 Nov;48(11):1271-82.
2.Cancer Sci. 2012 Dec;103(12):2102-9.
2.Cancer Sci. 2012 Dec;103(12):2102-9.
Product Image
Elisa

Figure 1: Black line: Control Antigen (100 ng); Purple line: Antigen(10ng); Blue line: Antigen (50 ng); Red line: Antigen (100 ng);
Western Blot

Figure 2:Western blot analysis using WTAP mAb against human WTAP (AA: 91-201) recombinant protein. (Expected MW is 38.7 kDa)
Western Blot

Figure 3:Western blot analysis using WTAP mAb against HEK293 (1) and WTAP (AA: 91-201)-hIgGFc transfected HEK293 (2) cell lysate.
Western Blot

Figure 4:Western blot analysis using WTAP mouse mAb against MCF-7 (1), Hela (2), K562 (3), Hek293 (4), A549 (5), HepG2 (6), Jurkat (7), and Cos7 (8) cell lysate.
Immunofluorescence analysis

Figure 5:Immunofluorescence analysis of Hela cells using WTAP mouse mAb (green). Blue: DRAQ5 fluorescent DNA dye. Red: Actin filaments have been labeled with Alexa Fluor- 555 phalloidin. Secondary antibody from Fisher (Cat#: 35503)
Flow cytometric
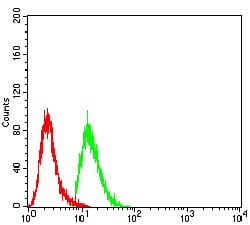
Figure 6:Flow cytometric analysis of A549 cells using WTAP mouse mAb (green) and negative control (red).
Immunohistochemical analysis
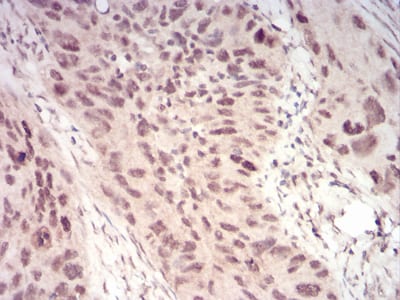
Figure 7:Immunohistochemical analysis of paraffin-embedded cervical cancer tissues using WTAP mouse mAb with DAB staining.
Immunohistochemical analysis
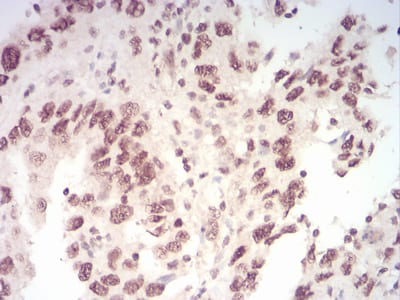
Figure 8:Immunohistochemical analysis of paraffin-embedded endometrial cancer tissues using WTAP mouse mAb with DAB staining.
For Research Use Only. Not for use in diagnostic procedures.