TBP Primary Antibody

Item Information
Catalog #
Size
Price
Description

Initiation of transcription by RNA polymerase II requires the activities of more than 70 polypeptides. The protein that coordinates these activities is transcription factor IID (TFIID), which binds to the core promoter to position the polymerase properly, serves as the scaffold for assembly of the remainder of the transcription complex, and acts as a channel for regulatory signals. TFIID is composed of the TATA-binding protein (TBP) and a group of evolutionarily conserved proteins known as TBP-associated factors or TAFs. TAFs may participate in basal transcription, serve as coactivators, function in promoter recognition or modify general transcription factors (GTFs) to facilitate complex assembly and transcription initiation. This gene encodes TBP, the TATA-binding protein. A distinctive feature of TBP is a long string of glutamines in the N-terminus. This region of the protein modulates the DNA binding activity of the C terminus, and modulation of DNA binding affects the rate of transcription complex formation and initiation of transcription. The number of CAG repeats encoding the polyglutamine tract is usually 25-42, and expansion of the number of repeats to 45-66 increases the length of the polyglutamine string and is associated with spinocerebellar ataxia 17, a neurodegenerative disorder classified as a polyglutamine disease. Two transcript variants encoding different isoforms have been found for this gene. [provided by RefSeq, Jul 2016]

Product Overview
Entrez GenelD
6908
Aliases
HDL4; GTF2D; SCA17; TFIID; GTF2D1
Clone#
7G11C8
Host / Isotype
Mouse / IgG1
Species Reactivity
Human
Immunogen
Purified recombinant fragment of human TBP (AA: 1-144) expressed in E. Coli.
Formulation
Purified antibody in PBS with 0.05% sodium azide
Storage
4°C; -20°C for long term storage
Product Applications
WB (Western Blot)
1/500 - 1/2000
IHC_P(Immunohistochemistry)
1/200 - 1/1000
ICC (Immunocytochemistry)
1/200 - 1/1000
FCM (Flow Cytometry)
1/200 - 1/400
ELISA
1/10000
References
1.J Virol. 2015 Nov;89(22):11406-19.
2.Biophys J. 2012 Oct 3;103(7):1510-7.
Product Image
Elisa
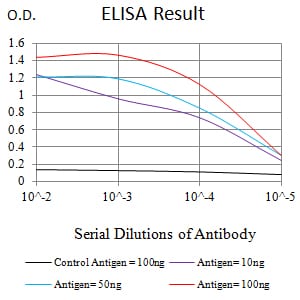
Figure 1:Black line: Control Antigen (100 ng);Purple line: Antigen (10ng); Blue line: Antigen (50 ng); Red line:Antigen (100 ng)
Western Blot
Figure 2:Western blot analysis using TBP mAb against human TBP (AA: 1-144) recombinant protein. (Expected MW is 41.9 kDa)
Western Blot
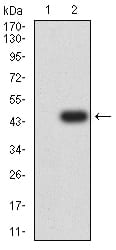
Figure 3:Western blot analysis using TBP mAb against HEK293 (1) and TBP (AA: 1-144)-hIgGFc transfected HEK293 (2) cell lysate.
Western Blot
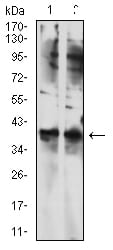
Figure 4:Western blot analysis using TBP mouse mAb against NIH/3T3 (1) and SK-N-SH (2) cell lysate.
Immunofluorescence analysis
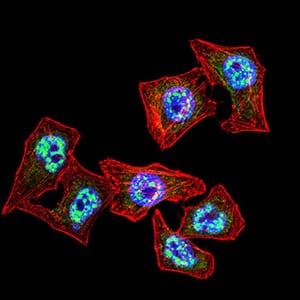
Figure 5:Immunofluorescence analysis of Hela cells using TBP mouse mAb (green). Blue: DRAQ5 fluorescent DNA dye. Red: Actin filaments have been labeled with Alexa Fluor- 555 phalloidin. Secondary antibody from Fisher (Cat#: 35503)
Flow cytometric
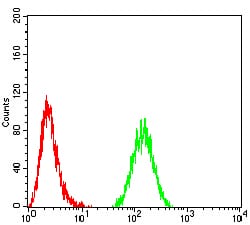
Figure 6:Flow cytometric analysis of Hela cells using TBP mouse mAb (green) and negative control (red).
Immunohistochemical analysis
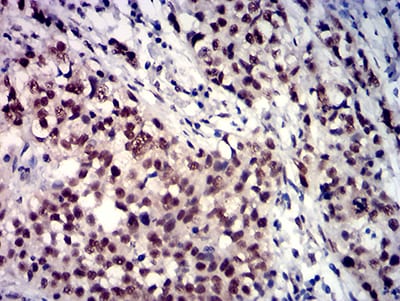
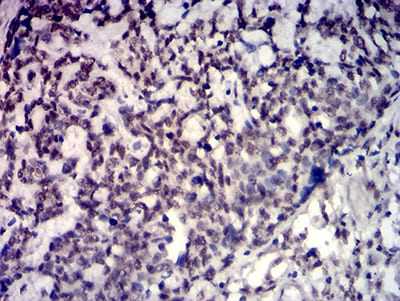
Figure 7:Immunohistochemical analysis of paraffin-embedded bladder cancer tissues using TBP mouse mAb with DAB staining.
Immunohistochemical analysis
Figure 8:Immunohistochemical analysis of paraffin-embedded esophageal cancer tissues using TBP mouse mAb with DAB staining.
For Research Use Only. Not for use in diagnostic procedures.