

RICTOR Primary Antibody
Item Information
Catalog #
Size
Price
Description
Cell growth is a fundamental biological process whereby cells accumulate mass and increase in size. The mammalian TOR (mTOR) pathway regulates growth by coordinating energy and nutrient signals with growth factor-derived signals . mTOR is a large protein kinase with two different complexes. One complex contains mTOR, G
Product Overview
Entrez GenelD
253260
Aliases
PIA; mAVO3; KIAA1999; MGC39830; DKFZp686B11164; RICTOR
Clone#
7B3
Host / Isotype
Mouse / IgG1
Species Reactivity
Human, Monkey, Mouse
Immunogen
Purified recombinant fragment of human RICTOR expressed in E. Coli.
Formulation
Ascitic fluid containing 0.03% sodium azide.
Storage
Store at 4°C short term. Aliquot and store at -20°C long term. Avoid freeze/thaw cycles.
Product Applications
WB (Western Blot)
1/500 - 1/2000
IHC_P(Immunohistochemistry)
1/200 - 1/1000
ICC (Immunocytochemistry)
1/200 - 1/1000
FCM (Flow Cytometry)
1/200 - 1/400
ELISA
1/10000
References
1. Genes Dev. 2006 Oct 15;20(20):2820-32.
2. Biochem Biophys Res Commun. 2008 Aug 8;372(4):578-83.
2. Biochem Biophys Res Commun. 2008 Aug 8;372(4):578-83.
Product Image
Western Blot

Figure 1: Western blot analysis using RICTOR mouse mAb against Hela (1), PANC-1 (2), MOLT4 (3), HepG2 (4) and HEK293 (5) cell lysate.
Immunofluorescence analysis
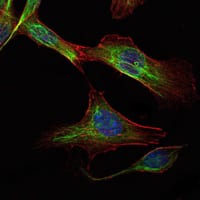
Figure 2: Immunofluorescence analysis of NIH/3T3 cells using RICTOR mouse mAb (green). Blue: DRAQ5 fluorescent DNA dye. Red: Actin filaments have been labeled with Alexa Fluor-555 phalloidin.
Immunohistochemical analysis

Figure 3: Immunohistochemical analysis of paraffin-embedded thyroid gland tissues (left) and human breast carcinoma (right) using RICTOR mouse mAb with DAB staining.
Flow cytometric
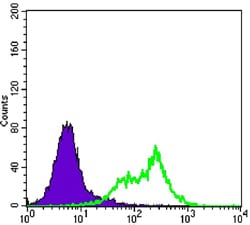
Figure 4: Flow cytometric analysis of Hela cells using RICTOR mouse mAb (green) and negative control (purple).
For Research Use Only. Not for use in diagnostic procedures.