

PSAP Primary Antibody
Item Information
Catalog #
Size
Price
Description
This gene encodes a highly conserved glycoprotein which is a precursor for 4 cleavage products: saposins A, B, C, and D. Each domain of the precursor protein is approximately 80 amino acid residues long with nearly identical placement of cysteine residues and glycosylation sites. Saposins A-D localize primarily to the lysosomal compartment where they facilitate the catabolism of glycosphingolipids with short oligosaccharide groups. The precursor protein exists both as a secretory protein and as an integral membrane protein and has neurotrophic activities. Mutations in this gene have been associated with Gaucher disease, Tay-Sachs disease, and metachromatic leukodystrophy. Alternative splicing results in multiple transcript variants encoding different isoforms.
Product Overview
Entrez GenelD
5660
Aliases
GLBA; SAP1
Clone#
4D5F4
Host / Isotype
Mouse / IgG1
Species Reactivity
Human
Immunogen
Purified recombinant fragment of human PSAP (AA: 325-524 ) expressed in E. Coli.
Formulation
Purified antibody in PBS with 0.05% sodium azide
Storage
Store at 4°C short term. Aliquot and store at -20°C long term. Avoid freeze/thaw cycles.
Product Applications
WB (Western Blot)
1/500 - 1/2000
IHC_P(Immunohistochemistry)
1/200 - 1/1000
ICC (Immunocytochemistry)
1/50 - 1/500
FCM (Flow Cytometry)
1/200 - 1/400
ELISA
1/10000
References
1.Biochem J. 2012 Jan 15;441(2):665-74.
2.Mol Cancer. 2010 Feb 4;9:30.
2.Mol Cancer. 2010 Feb 4;9:30.
Product Image
Western Blot
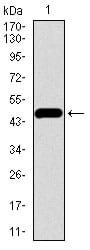
Figure 1: Western blot analysis using PSAP mAb against human PSAP recombinant protein. (Expected MW is 47.8 kDa)
Western Blot

Figure 2: Western blot analysis using PSAP mAb against HEK293 (1) and PSAP (AA: 325-524)-hIgGFc transfected HEK293 (2) cell lysate.
Immunofluorescence analysis

Figure 3: Immunofluorescence analysis of HepG2 cells using PSAP mouse mAb (green). Blue: DRAQ5 fluorescent DNA dye. Red: Actin filaments have been labeled with Alexa Fluor-555 phalloidin.
Flow cytometric

Figure 4: Flow cytometric analysis of HeLa cells using PSAP mouse mAb (green) and negative control (purple).
Immunohistochemical analysis
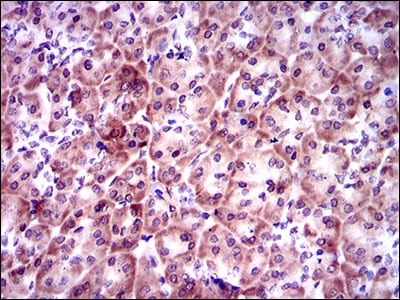
Figure 5: mmunohistochemical analysis of paraffin-embedded pancreas tissues using PSAP mouse mAb with DAB staining.
Elisa

Black line: Control Antigen (100 ng); Purple line: Antigen(10ng); Blue line: Antigen (50 ng); Red line: Antigen (100 ng);
For Research Use Only. Not for use in diagnostic procedures.