

PLCG1 Primary Antibody
Item Information
Catalog #
Size
Price
Description
The protein encoded by this gene catalyzes the formation of inositol 1,4,5-trisphosphate and diacylglycerol from phosphatidylinositol 4,5-bisphosphate. This reaction uses calcium as a cofactor and plays an important role in the intracellular transduction of receptor-mediated tyrosine kinase activators. For example, when activated by SRC, the encoded protein causes the Ras guanine nucleotide exchange factor RasGRP1 to translocate to the Golgi, where it activates Ras. Also, this protein has been shown to be a major substrate for heparin-binding growth factor 1 (acidic fibroblast growth factor)-activated tyrosine kinase. Two transcript variants encoding different isoforms have been found for this gene.
Product Overview
Entrez GenelD
5335
Aliases
PLC1; NCKAP3; PLC-II; PLC148; PLCgamma1
Clone#
3C2D11
Host / Isotype
Mouse / IgG1
Species Reactivity
Human, Monkey, Rat
Immunogen
Purified recombinant fragment of human PLCG1 (AA: 1192-1291) expressed in E. Coli.
Formulation
Purified antibody in PBS with 0.05% sodium azide
Storage
Store at 4°C short term. Aliquot and store at -20°C long term. Avoid freeze/thaw cycles.
Product Applications
WB (Western Blot)
1/500 - 1/2000
IHC_P(Immunohistochemistry)
1/200 - 1/1000
ICC (Immunocytochemistry)
1/200 - 1/1000
FCM (Flow Cytometry)
1/200 - 1/400
ELISA
1/10000
References
1.Cancer Discov. 2014 Apr;4(4):OF13.
2.Int J Cancer. 2013 Mar 1;132(5):1022-31.
2.Int J Cancer. 2013 Mar 1;132(5):1022-31.
Product Image
Elisa

Figure 1: Black line: Control Antigen (100 ng); Purple line: Antigen(10ng); Blue line: Antigen (50 ng); Red line: Antigen (100 ng);
Western Blot

Figure 2:Western blot analysis using PLCG1 mAb against human PLCG1 (AA: 1192-1291) recombinant protein. (Expected MW is 37.5 kDa)
Western Blot
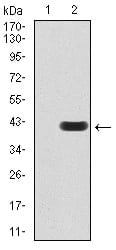
Figure 3:Western blot analysis using PLCG1 mAb against HEK293 (1) and PLCG1 (AA: 1192-1291)-hIgGFc transfected HEK293 (2) cell lysate.
Western Blot

Figure 4:Western blot analysis using PLCG1 mouse mAb against Hela (1), A431 (2), C6 (3), NIH/3T3 (4), COS7 (5), and HCT116 (6) cell lysate.
Immunofluorescence analysis

Figure 5:Immunofluorescence analysis of HeLa cells using PLCG1 mouse mAb (green). Blue: DRAQ5 fluorescent DNA dye. Red: Actin filaments have been labeled with Alexa Fluor- 555 phalloidin. Secondary antibody from Fisher (Cat#: 35503)
Flow cytometric

Figure 6:Flow cytometric analysis of Jurkat cells using PLCG1 mouse mAb (green) and negative control (red).
Immunohistochemical analysis

Figure 7:Immunohistochemical analysis of paraffin-embedded cervical cancer tissues using PLCG1 mouse mAb with DAB staining.
Immunohistochemical analysis

Figure 8:Immunohistochemical analysis of paraffin-embedded bladder cancer tissues using PLCG1 mouse mAb with DAB staining.
For Research Use Only. Not for use in diagnostic procedures.