
PKN1 Primary Antibody
Item Information
Catalog #
Size
Price
Description
The protein encoded by this gene belongs to the protein kinase C superfamily. This kinase is activated by Rho family of small G proteins and may mediate the Rho-dependent signaling pathway. This kinase can be activated by phospholipids and by limited proteolysis. The 3-phosphoinositide dependent protein kinase-1 (PDPK1/PDK1) is reported to phosphorylate this kinase, which may mediate insulin signals to the actin cytoskeleton. The proteolytic activation of this kinase by caspase-3 or related proteases during apoptosis suggests its role in signal transduction related to apoptosis. Alternatively spliced transcript variants encoding distinct isoforms have been observed.
Product Overview
Entrez GenelD
5585
Aliases
DBK; PKN; PAK1; PRK1; PAK-1; PRKCL1; PKN-ALPHA
Clone#
4H10B1
Host / Isotype
Mouse / IgG2b
Species Reactivity
Human
Immunogen
Purified recombinant fragment of human PKN1 (AA: 442-620) expressed in E. Coli.
Formulation
Purified antibody in PBS with 0.05% sodium azide.
Storage
Store at 4°C short term. Aliquot and store at -20°C long term. Avoid freeze/thaw cycles.
Product Applications
WB (Western Blot)
1/500 - 1/2000
IHC_P(Immunohistochemistry)
1/200 - 1/1000
ICC (Immunocytochemistry)
1/200 - 1/1000
FCM (Flow Cytometry)
1/200 - 1/400
ELISA
1/10000
References
1. J Biol Chem. 2013 Nov 29;288(48):34658-70.
2. Hum Pathol. 2009 Oct;40(10):1434-40.
2. Hum Pathol. 2009 Oct;40(10):1434-40.
Product Image
Western Blot
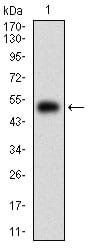
Figure 1: Western blot analysis using PKN1 mAb against human PKN1 (AA: 442-620) recombinant protein. (Expected MW is 45.7 kDa)
Western Blot
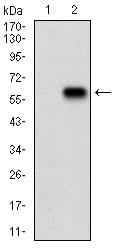
Figure 2: Western blot analysis using PKN1 mAb against HEK293 (1) and PKN1 (AA: 442-620)-hIgGFc transfected HEK293 (2) cell lysate.
Immunofluorescence analysis

Figure 3:Immunofluorescence analysis of Hela cells using PKN1 mouse mAb (green). Blue: DRAQ5 fluorescent DNA dye. Red: Actin filaments have been labeled with Alexa Fluor- 555 phalloidin. Secondary antibody from Fisher (Cat#: 35503)
Flow cytometric

Figure 4: Flow cytometric analysis of Hela cells using PKN1 mouse mAb (green) and negative control (red).
Immunohistochemical analysis

Figure 5: Immunohistochemical analysis of paraffin-embedded colon cancer tissues using PKN1 mouse mAb with DAB staining.
Elisa

Black line: Control Antigen (100 ng); Purple line: Antigen(10ng); Blue line: Antigen (50 ng); Red line: Antigen (100 ng);
For Research Use Only. Not for use in diagnostic procedures.