
mouse Splunc2 Primary Antibody
Item Information
Catalog #
Size
Price
Description
N/A
Product Overview
Entrez GenelD
19194
Clone#
1F12
Host / Isotype
Mouse / IgG1
Species Reactivity
Human
Immunogen
Purified recombinant fragment of mouse Splunc2 expressed in E. Coli.
Formulation
Purified antibody in PBS with 0.05% sodium azide
Storage
Store at 4°C short term. Aliquot and store at -20°C long term. Avoid freeze/thaw cycles.
Product Applications
WB (Western Blot)
1/500 - 1/2000
IHC_P(Immunohistochemistry)
1/200 - 1/1000
ICC (Immunocytochemistry)
1/200 - 1/1000
FCM (Flow Cytometry)
1/200 - 1/400
ELISA
1/10000
Product Image
Western Blot
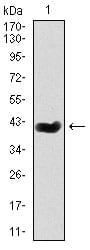
Figure 1: Western blot analysis using mouse Splunc2 mAb against mouse Splunc2 (AA: 16-169) recombinant protein. (Expected MW is 41.6 kDa)
Immunohistochemical analysis
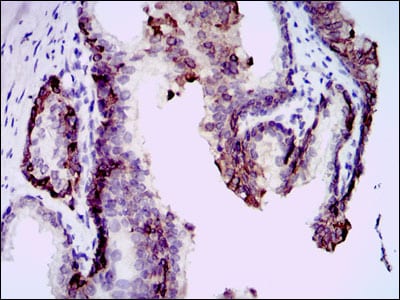
Figure 2: Immunohistochemical analysis of paraffin-embedded prostate tissues using mouse Splunc2 mouse mAb with DAB staining.
Immunohistochemical analysis
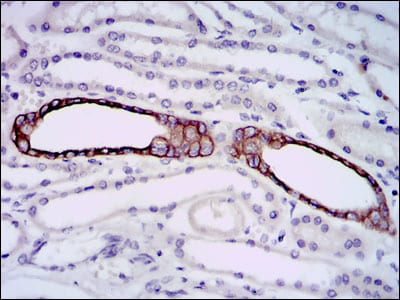
Figure 3: Immunohistochemical analysis of paraffin-embedded kidney tissues using mouse Splunc2 mouse mAb with DAB staining.
Immunofluorescence analysis

Figure 4: Immunofluorescence analysis of HepG2 cells. Blue: DRAQ5 fluorescent DNA dye. Red: Actin filaments have been labeled with Alexa Fluor-555 phalloidin.
Immunofluorescence analysis

Figure 5: Immunofluorescence analysis of HepG2 cells using mouse Splunc2 mouse mAb (green). Red: Actin filaments have been labeled with Alexa Fluor-555 phalloidin.
Flow cytometric

Figure 6: Flow cytometric analysis of HeLa cells using mouse Splunc2 mouse mAb (green) and negative control (red).
Elisa

Black line: Control Antigen (100 ng); Purple line: Antigen(10ng); Blue line: Antigen (50 ng); Red line: Antigen (100 ng);
For Research Use Only. Not for use in diagnostic procedures.