
Mouse Monoclonal Antibody to IL1A
Item Information
Catalog #
Size
Price
Description
The protein encoded by this gene is a member of the interleukin 1 cytokine family. This cytokine is a pleiotropic cytokine involved in various immune responses, inflammatory processes, and hematopoiesis. This cytokine is produced by monocytes and macrophages as a proprotein, which is proteolytically processed and released in response to cell injury, and thus induces apoptosis. This gene and eight other interleukin 1 family genes form a cytokine gene cluster on chromosome 2. It has been suggested that the polymorphism of these genes is associated with rheumatoid arthritis and Alzheimer's disease.
Product Overview
Entrez GenelD
3552
Aliases
IL1; IL-1A; IL1F1; IL1-ALPHA; IL-1 alpha
Clone#
6G4A5
Host / Isotype
Mouse / IgG1
Immunogen
Purified recombinant fragment of human IL1A (AA: extra(155-354)) expressed in E. Coli.
Formulation
Purified antibody in PBS with 0.05% sodium azide
Storage
Store at 4°C short term. Aliquot and store at -20°C long term. Avoid freeze/thaw cycles.
Product Applications
WB (Western Blot)
1/500 - 1/2000
FCM (Flow Cytometry)
1/200 - 1/400
ELISA
1/10000
References
1,Noise Health. Mar-Apr 2019;21(99):77-82. 2,Crit Care. 2020 Jul 18;24(1):445.
Product Image
Elisa

Figure 1:Black line: Control Antigen (100 ng);Purple line: Antigen (10ng); Blue line: Antigen (50 ng); Red line:Antigen (100 ng)
Western Blot

Figure 2:Western blot analysis using IL1A mAb against human IL1A (AA: 113-271) recombinant protein. (Expected MW is 44 kDa)
Flow cytometric analysis

Figure 3:Flow cytometric analysis of Jurkat cells using IL1A mouse mAb (green) and negative control (red).
Flow cytometric analysis

Figure 4:Flow cytometric analysis of MOLT4 cells using IL1A mouse mAb (green) and negative control (red).
Flow cytometric analysis
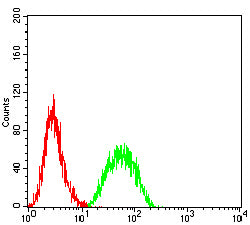
Figure 5:Flow cytometric analysis of THP-1 cells using IL1A mouse mAb (green) and negative control (red).
For Research Use Only. Not for use in diagnostic procedures.