
HSP90AA1 Primary Antibody
Item Information
Catalog #
Size
Price
Description
HSP90 proteins are highly conserved molecular chaperones that have key roles in signal transduction, protein folding, protein degradation, and morphologic evolution. HSP90 proteins normally associate with other cochaperones and play important roles in folding newly synthesized proteins or stabilizing and refolding denatured proteins after stress. There are 2 major cytosolic HSP90 proteins, HSP90AA1, an inducible form, and HSP90AB1 (MIM 140572), a constitutive form. Other HSP90 proteins are found in endoplasmic reticulum (HSP90B1; MIM 191175) and mitochondria (TRAP1; MIM 606219) (Chen et al., 2005 [PubMed 16269234]).
Product Overview
Entrez GenelD
3320
Aliases
HSPN; LAP2; HSP86; HSPC1; HSPCA; Hsp89; Hsp90; HSP89A; HSP90A; HSP90N; HSPCAL1; HSPCAL4
Clone#
5G5
Host / Isotype
Mouse / IgG1
Species Reactivity
Human, Mouse, Monkey
Immunogen
Purified recombinant fragment of human HSP90AA1 expressed in E. Coli.
Formulation
Purified antibody in PBS with 0.05% sodium azide
Storage
Store at 4°C short term. Aliquot and store at -20°C long term. Avoid freeze/thaw cycles.
Product Applications
WB (Western Blot)
1/500 - 1/2000
IHC_P(Immunohistochemistry)
1/200 - 1/1000
FCM (Flow Cytometry)
1/200 - 1/400
ELISA
1/10000
References
Mol Biol Cell. 2010 May 1;21(9):1462-9.
Mol Cancer Ther. 2009 Dec;8(12):3296-306.
Mol Cancer Ther. 2009 Dec;8(12):3296-306.
Product Image
Western Blot

Figure 1: Western blot analysis using HSP90AA1 mAb against human HSP90AA1 (AA: 275-484) recombinant protein. (Expected MW is 50.5 kDa)
Western Blot
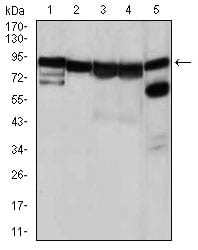
Figure 2: Western blot analysis using HSP90AA1 mouse mAb against NIH3T3 (1), HeLa (2), HCT116(3), HL-60 (4) and C0S7 (5) cell lysate.
Immunohistochemical analysis

Figure 3: Immunohistochemical analysis of paraffin-embedded lung cancer tissues using HSP90AA1 mouse mAb with DAB staining.
Immunohistochemical analysis

Figure 4: Immunohistochemical analysis of paraffin-embedded bladder cancer tissues using HSP90AA1 mouse mAb with DAB staining.
Flow cytometric

Figure 5: Flow cytometric analysis of HeLa cells using HSP90AA1 mouse mAb (green) and negative control (red).
Elisa

Black line: Control Antigen (100 ng); Purple line: Antigen(10ng); Blue line: Antigen (50 ng); Red line: Antigen (100 ng);
For Research Use Only. Not for use in diagnostic procedures.