
FTL Primary Antibody
Item Information
Catalog #
Size
Price
Description
This gene encodes the light subunit of the ferritin protein. Ferritin is the major intracellular iron storage protein in prokaryotes and eukaryotes. It is composed of 24 subunits of the heavy and light ferritin chains. Variation in ferritin subunit composition may affect the rates of iron uptake and release in different tissues. A major function of ferritin is the storage of iron in a soluble and nontoxic state. Defects in this light chain ferritin gene are associated with several neurodegenerative diseases and hyperferritinemia-cataract syndrome. This gene has multiple pseudogenes.
Product Overview
Entrez GenelD
2512
Aliases
NBIA3
Clone#
6E10E4
Host / Isotype
Mouse / IgG1
Species Reactivity
Human
Immunogen
Purified recombinant fragment of human FTL (AA: FULL(1-175)) expressed in E. Coli.
Formulation
Purified antibody in PBS with 0.05% sodium azide.
Storage
Store at 4°C short term. Aliquot and store at -20°C long term. Avoid freeze/thaw cycles.
Product Applications
WB (Western Blot)
1/500 - 1/2000
IHC_P(Immunohistochemistry)
1/200 - 1/1000
FCM (Flow Cytometry)
1/200 - 1/400
ELISA
1/10000
References
1. Free Radic Biol Med. 2012 May 1;52(9):1692-7.
2. Neurobiol Dis. 2010 Jan;37(1):77-85.
2. Neurobiol Dis. 2010 Jan;37(1):77-85.
Product Image
Western Blot

Figure 1: Western blot analysis using FTL mAb against human FTL (AA: FULL(1-175)) recombinant protein. (Expected MW is 45.5 kDa)
Western Blot
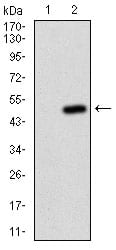
Figure 2: Western blot analysis using FTL mAb against HEK293 (1) and FTL (AA: FULL(1-175))-hIgGFc transfected HEK293 (2) cell lysate.
Western Blot

Figure 3: Western blot analysis using FTL mouse mAb against HepG2 (1), K562 (2) cell lysate.
Flow cytometric
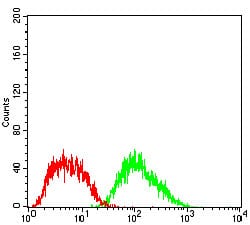
Figure 4: Flow cytometric analysis of HepG2 cells using FTL mouse mAb (green) and negative control (red).
Immunohistochemical analysis

Figure 5: Immunohistochemical analysis of paraffin-embedded ovarian cancer tissues using FTL mouse mAb with DAB staining.
Immunohistochemical analysis

Figure 6: Immunohistochemical analysis of paraffin-embedded esophageal tissues using FTL mouse mAb with DAB staining.
Elisa

Black line: Control Antigen (100 ng); Purple line: Antigen(10ng); Blue line: Antigen (50 ng); Red line: Antigen (100 ng);
For Research Use Only. Not for use in diagnostic procedures.