
Mouse Monoclonal Antibody to ETFA
Item Information
Catalog #
Size
Price
Description
ETFA participates in catalyzing the initial step of the mitochondrial fatty acid beta-oxidation. It shuttles electrons between primary flavoprotein dehydrogenases and the membrane-bound electron transfer flavoprotein ubiquinone oxidoreductase. Defects in electron-transfer-flavoprotein have been implicated in type II glutaricaciduria in which multiple acyl-CoA dehydrogenase deficiencies result in large excretion of glutaric, lactic, ethylmalonic, butyric, isobutyric, 2-methyl-butyric, and isovaleric acids. Two transcript variants encoding different isoforms have been found for this gene. [provided by RefSeq, Jul 2008]
Product Overview
Entrez GenelD
2108
Aliases
EMA; GA2; MADD
Clone#
2F8A5
Host / Isotype
Mouse / IgG2a
Immunogen
Purified recombinant fragment of human ETFA (AA: 134-333) expressed in E. Coli.
Formulation
Purified antibody in PBS with 0.05% sodium azide
Storage
Store at 4°C short term. Aliquot and store at -20°C long term. Avoid freeze/thaw cycles.
Product Applications
WB (Western Blot)
1/500 - 1/2000
IHC_P(Immunohistochemistry)
1/200 - 1/1000
ICC (Immunocytochemistry)
1/200 - 1/1000
FCM (Flow Cytometry)
1/200 - 1/400
ELISA
1/10000
References
1.Toxicology.2014 Feb 28;316:61-70.2.BMC Med Genomics.2020 Jan 29;13(1):12.
Product Image
Elisa
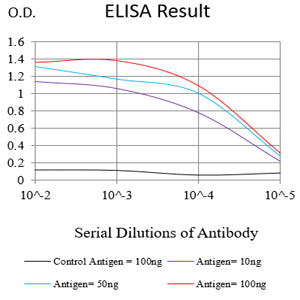
Figure 1:Black line: Control Antigen (100 ng);Purple line: Antigen (10ng); Blue line: Antigen (50 ng); Red line:Antigen (100 ng)
Western Blot

Figure 2:Western blot analysis using ETFA mAb against human ETFA (AA: 134-333) recombinant protein. (Expected MW is 24 kDa)
Western Blot

Figure 3:Western blot analysis using ETFA mAb against HEK293 (1) and ETFA (AA:134-333)-hIgGFc transfected HEK293-6e (2) cell lysate.
Western Blot

Figure 4:Western blot analysis using ETFA mouse mAb against .HepG2 (1), A431 (2), Hek293 (3),Hela (4)and MCF-7 (5) cell lysate.
Immunofluorescence analysis
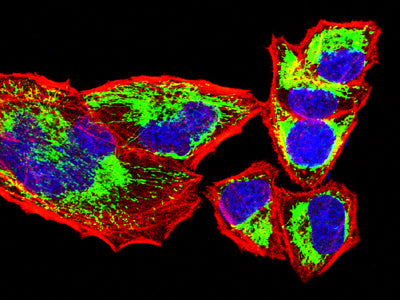
Figure 5:Immunofluorescence analysis of Hela cells using ETFA mouse mAb (green). Blue: DRAQ5 fluorescent DNA dye. Red: Actin filaments have been labeled with Alexa Fluor- 555 phalloidin. Secondary antibody from Fisher (Cat#: 35503)
Flow cytometric analysis

Figure 6:Flow cytometric analysis of Hela cells using ETFA mouse mAb (green) and negative control (red).
Flow cytometric analysis
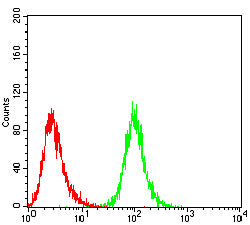
Figure 7:Flow cytometric analysis of HepG2 cells using ETFA mouse mAb (green) and negative control (red).
Immunohistochemical analysis

Figure 8:Immunohistochemical analysis of paraffin-embedded cervical carcinoma tissues using ETFA mouse mAb with DAB staining.
Immunohistochemical analysis

Figure 9:Immunohistochemical analysis of paraffin-embedded rectal cancer tissues using ETFA mouse mAb with DAB staining.
For Research Use Only. Not for use in diagnostic procedures.