
CD5 Primary Antibody
Item Information
Catalog #
Size
Price
Description
This gene encodes a member of the scavenger receptor cysteine-rich (SRCR) superfamily. Members of this family are secreted or membrane-anchored proteins mainly found in cells associated with the immune system. This protein is a type-I transmembrane glycoprotein found on the surface of thymocytes, T lymphocytes and a subset of B lymphocytes. The encoded protein contains three SRCR domains and may act as a receptor to regulate T-cell proliferation. Alternative splicing results in multiple transcript variants encoding different isoforms. [provided by RefSeq, Oct 2016]
Product Overview
Entrez GenelD
921
Aliases
T1; LEU1
Clone#
6C3B2
Host / Isotype
Mouse / Mouse IgG1
Immunogen
Purified recombinant fragment of human CD5 (AA: 403-495) expressed in E. Coli.
Formulation
Purified antibody in PBS with 0.05% sodium azide
Storage
Store at 4°C short term. Aliquot and store at -20°C long term. Avoid freeze/thaw cycles.
Product Applications
WB (Western Blot)
1/500 - 1/2000
IHC_P(Immunohistochemistry)
1/200-1/1000
FCM (Flow Cytometry)
1/200-1/400
ELISA
1/10000
References
1,J Hematol Oncol. 2019 May 16;12(1):49. 2,Am J Surg Pathol. 2019 Aug;43(8):1052-1060.
Product Image
ELISA
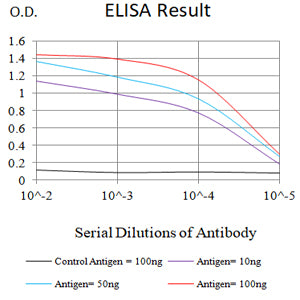
Figure 1: Black line: Control Antigen (100 ng);Purple line: Antigen (10ng); Blue line: Antigen (50 ng); Red line: Antigen (100 ng)
WESTERN BLOT
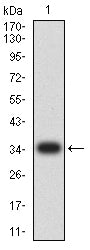
Figure 2: Western blot analysis using CD5 mAb against human CD5 (AA: 403-495) recombinant protein. (Expected MW is 35.4 kDa)
WESTERN BLOT
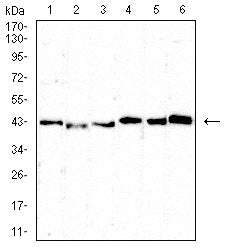
Figure 4: Western blot analysis using CD5 mouse mAb against MOLT4 (1), MOLT4 (2),U937 (3),L1210 (4) ,HEK239 (5) ,and HEK293-6e (6) cell lysate.
FLOW CYTOMETRY
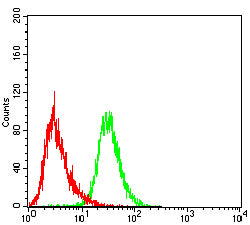
Figure 4: Flow cytometric analysis of THP-1 cells using CD5 mouse mAb (green) and negative control (red).
FLOW CYTOMETRY

Figure 5: Flow cytometric analysis of Jurkat cells using CD5 mouse mAb (green) and negative control (red).
IMMUNOHISTOCHEMISTRY
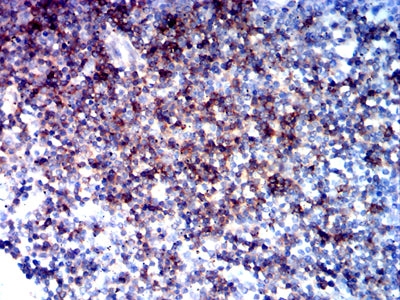
Figure 6: Immunohistochemical analysis of paraffin-embedded tonsil tissues using CD5 mouse mAb with DAB staining.
For Research Use Only. Not for use in diagnostic procedures.