
CD158E1 Primary Antibody
Item Information
Catalog #
Size
Price
Description
Killer cell immunoglobulin-like receptors (KIRs) are transmembrane glycoproteins expressed by natural killer cells and subsets of T cells. The KIR genes are polymorphic and highly homologous and they are found in a cluster on chromosome 19q13.4 within the 1 Mb leukocyte receptor complex (LRC). The gene content of the KIR gene cluster varies among haplotypes, although several "framework" genes are found in all haplotypes (KIR3DL3, KIR3DP1, KIR3DL4, KIR3DL2). The KIR proteins are classified by the number of extracellular immunoglobulin domains (2D or 3D) and by whether they have a long (L) or short (S) cytoplasmic domain. KIR proteins with the long cytoplasmic domain transduce inhibitory signals upon ligand binding via an immune tyrosine-based inhibitory motif (ITIM), while KIR proteins with the short cytoplasmic domain lack the ITIM motif and instead associate with the TYRO protein tyrosine kinase binding protein to transduce activating signals. The ligands for several KIR proteins are subsets of HLA class I molecules; thus, KIR proteins are thought to play an important role in regulation of the immune response.
Product Overview
Entrez GenelD
3811
Aliases
KIR3DL1; KIR; NKB1; NKAT3; NKB1B; NKAT-3; KIR3DL1/S1
Clone#
2C3A10
Host / Isotype
Mouse / IgG1
Species Reactivity
Human
Immunogen
Purified recombinant fragment of human CD158E1 (AA: extra 206-340) expressed in E. Coli.
Formulation
Purified antibody in PBS with 0.05% sodium azide
Storage
Store at 4°C short term. Aliquot and store at -20°C long term. Avoid freeze/thaw cycles.
Product Applications
WB (Western Blot)
1/500 - 1/2000
FCM (Flow Cytometry)
1/200 - 1/400
ELISA
1/10000
References
1.Clin Exp Immunol. 2016 Mar;183(3):419-30.
2.J Leukoc Biol. 2010 Nov;88(5):905-12.
2.J Leukoc Biol. 2010 Nov;88(5):905-12.
Product Image
Elisa

Figure 1: Black line: Control Antigen (100 ng);Purple line: Antigen (10ng); Blue line: Antigen (50 ng); Red line:Antigen (100 ng)
Western Blot

Figure 2:Western blot analysis using CD158E1 mAb against human CD158E1 (AA: extra 206-340) recombinant protein. (Expected MW is 40.5 kDa)
Western Blot
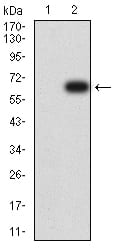
Figure 3:Western blot analysis using CD158E1 mAb against HEK293 (1) and CD158E1 (AA: extra 206-340)-hIgGFc transfected HEK293 (2) cell lysate.
Flow cytometric

Figure 4:Flow cytometric analysis of HL-60 cells using CD158E1 mouse mAb (green) and negative control (red).
Flow cytometric

Figure 5:Flow cytometric analysis of Ramos cells using CD158E1 mouse mAb (green) and negative control (red).
For Research Use Only. Not for use in diagnostic procedures.