

CARM1 Primary Antibody
Item Information
Catalog #
Size
Price
Description
Protein arginine N-methyltransferases, such as CARM1, catalyze the transfer of a methyl group from S-adenosyl-L-methionine to the side chain nitrogens of arginine residues within proteins to form methylated arginine derivatives and S-adenosyl-L-homocysteine. Protein arginine methylation has been implicated in signal transduction, metabolism of nascent pre-RNA, and transcriptional activation (Frankel et al. 2002 (PubMed 11724789). Tissue specificity: Overexpressed in prostate adenocarcinomas and high-grade prostatic intraepithelial neoplasia.
Product Overview
Entrez GenelD
10498
Aliases
PRMT4; CARM1
Clone#
3H2
Host / Isotype
Mouse / IgG1
Species Reactivity
Human, Monkey, Rat
Immunogen
Purified recombinant fragment of human CARM1 expressed in E. Coli.
Formulation
Ascitic fluid containing 0.03% sodium azide.
Storage
Store at 4°C short term. Aliquot and store at -20°C long term. Avoid freeze/thaw cycles.
Product Applications
WB (Western Blot)
1/500 - 1/2000
IHC_P(Immunohistochemistry)
1/200 - 1/1000
ICC (Immunocytochemistry)
1/200 - 1/1000
FCM (Flow Cytometry)
1/200 - 1/400
ELISA
1/10000
References
1. FASEB J. 2008 Sep;22(9):3337-47.
2. Nucleic Acids Res. 2008 Jun;36(10):3202-13.
2. Nucleic Acids Res. 2008 Jun;36(10):3202-13.
Product Image
Western Blot

Figure 1: Western blot analysis using CARM1 mouse mAb against MCF-7 (1), Hela (2), NIH/3T3 (3), HL-60 (4), LNcap (5), Jurkat (6), PC-3 (7), Cos7 (8), and PC-12 (9) cell lysate.
Immunohistochemical analysis

Figure 2: Immunohistochemical analysis of paraffin-embedded breast cancer tissues (left) and ovarian cancer tissues (right) using CARM1 mouse mAb with DAB staining.
Immunofluorescence analysis
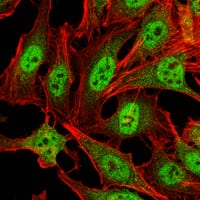
Figure 3: Immunofluorescence analysis of Hela cells using CRAM1 mouse mAb (green). Red: Actin filaments have been labeled with Alexa Fluor-555 phalloidin.
Flow cytometric

Figure 4: Flow cytometric analysis of Lovo cells using CARM1 mouse mAb (green) and negative control (purple).
For Research Use Only. Not for use in diagnostic procedures.