

BTN2A2 Primary Antibody
Item Information
Catalog #
Size
Price
Description
Butyrophilin is the major protein associated with fat droplets in the milk. This gene is a member of the BTN2 subfamily of genes, which encode proteins belonging to the butyrophilin protein family. The gene is located in a cluster on chromosome 6, consisting of seven genes belonging to the expanding B7/butyrophilin-like group, a subset of the immunoglobulin gene superfamily. The encoded protein is a type I receptor glycoprotein involved in lipid, fatty-acid and sterol metabolism. Several alternatively spliced transcript variants encoding different isoforms have been found for this gene.
Product Overview
Entrez GenelD
10385
Aliases
BTF2; BT2.2; BTN2.2
Clone#
4B11C8
Host / Isotype
Mouse / IgG2a
Species Reactivity
Human
Immunogen
Purified recombinant fragment of human BTN2A2 (AA: extra 57-237) expressed in E. Coli.
Formulation
Purified antibody in PBS with 0.05% sodium azide
Storage
Store at 4°C short term. Aliquot and store at -20°C long term. Avoid freeze/thaw cycles.
Product Applications
WB (Western Blot)
1/500 - 1/2000
ICC (Immunocytochemistry)
1/200 - 1/1000
FCM (Flow Cytometry)
1/200 - 1/400
ELISA
1/10000
References
1.J Exp Med. 2016 Feb 8;213(2):177-87.
2.Proteomics. 2002 Jul;2(7):850-6.
2.Proteomics. 2002 Jul;2(7):850-6.
Product Image
Elisa

Figure 1: Black line: Control Antigen (100 ng);Purple line: Antigen (10ng); Blue line: Antigen (50 ng); Red line:Antigen (100 ng)
Western Blot

Figure 2:Western blot analysis using BTN2A2 mAb against human BTN2A2 (AA: extra 57-237) recombinant protein. (Expected MW is 46.4 kDa)
Western Blot
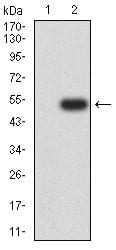
Figure 3:Western blot analysis using BTN2A2 mAb against HEK293 (1) and BTN2A2 (AA: extra 57-237)-hIgGFc transfected HEK293 (2) cell lysate.
Western Blot
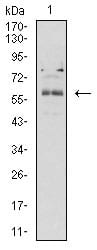
Figure 4:Western blot analysis using BTN2A2 mouse mAb against K562 (1) cell lysate.
Flow cytometric

Figure 5:Flow cytometric analysis of Hela cells using BTN2A2 mouse mAb (green) and negative control (red).
Immunofluorescence analysis

Figure 6:Immunofluorescence analysis of Hela cells using BTN2A2 mouse mAb (green). Blue: DRAQ5 fluorescent DNA dye. Red: Actin filaments have been labeled with Alexa Fluor- 555 phalloidin. Secondary antibody from Fisher (Cat#: 35503)
For Research Use Only. Not for use in diagnostic procedures.