

ATM Primary Antibody
Item Information
Catalog #
Size
Price
Description
The protein encoded by this gene belongs to the PI3/PI4-kinase family. This protein is an important cell cycle checkpoint kinase that phosphorylates; thus, it functions as a regulator of a wide variety of downstream proteins, including tumor suppressor proteins p53 and BRCA1, checkpoint kinase CHK2, checkpoint proteins RAD17 and RAD9, and DNA repair protein NBS1. This protein and the closely related kinase ATR are thought to be master controllers of cell cycle checkpoint signaling pathways that are required for cell response to DNA damage and for genome stability. Mutations in this gene are associated with ataxia telangiectasia, an autosomal recessive disorder.
Product Overview
Entrez GenelD
472
Aliases
AT1; ATA; ATC; ATD; ATE; ATDC; TEL1; TELO1
Clone#
3H12H8
Host / Isotype
Mouse / Mouse IgG2b
Species Reactivity
Human, Mouse, Monkey, Rat
Immunogen
Purified recombinant fragment of human ATM (AA: 2577-3056) expressed in E. Coli.
Formulation
Purified antibody in PBS with 0.05% sodium azide
Storage
Store at 4°C short term. Aliquot and store at -20°C long term. Avoid freeze/thaw cycles.
Product Applications
IHC_P(Immunohistochemistry)
1/200 - 1/1000
ICC (Immunocytochemistry)
1/200 - 1/1000
FCM (Flow Cytometry)
1/200 - 1/400
ELISA
1/10000
References
MC Cancer. 2021 Jan 5;21(1):27.
Fam Cancer. 2022 Apr;21(2):211-227.
Fam Cancer. 2022 Apr;21(2):211-227.
Product Image
Elisa

Figure 1:Black line: Control Antigen (100 ng);Purple line: Antigen (10ng); Blue line: Antigen (50 ng); Red line:Antigen (100 ng)
Immunohistochemical analysis

Figure 2:Immunofluorescence analysis of Hela cells using ATM mouse mAb (green). Blue: DRAQ5 fluorescent DNA dye. Red: Actin filaments have been labeled with Alexa Fluor- 555 phalloidin. Secondary antibody from Fisher (Cat#: 35503)
Immunohistochemical analysis

Figure 3:Immunofluorescence analysis of NIH/3T3 cells using ATM mouse mAb (green). Blue: DRAQ5 fluorescent DNA dye. Red: Actin filaments have been labeled with Alexa Fluor- 555 phalloidin. Secondary antibody from Fisher (Cat#: 35503)
Immunofluorescence analysis

Figure 4:Flow cytometric analysis of Hela cells using ATM mouse mAb (green) and negative control (red).
Immunofluorescence analysis
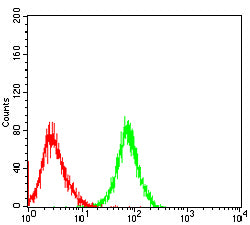
Figure 5:Flow cytometric analysis of COS-7 cells using ATM mouse mAb (green) and negative control (red).
Immunohistochemical analysis

Figure 6:Immunohistochemical analysis of paraffin-embedded kidney tissues using ATM mouse mAb with DAB staining.
Immunohistochemical analysis

Figure 7:Immunohistochemical analysis of paraffin-embedded gastric cancer tissues using ATM mouse mAb with DAB staining.
Immunohistochemical analysis

Figure 8:Immunohistochemical analysis of paraffin-embedded Mouse spleen tissues using ATM mouse mAb with DAB staining.
Immunohistochemical analysis

Figure 9:Immunohistochemical analysis of paraffin-embedded Rat myocardium tissues using ATM mouse mAb with DAB staining.
Immunohistochemical analysis

Figure 10:Immunohistochemical analysis of paraffin-embedded Rabbit spleen tissues using ATM mouse mAb with DAB staining.
For Research Use Only. Not for use in diagnostic procedures.