
APEX1 Primary Antibody
Item Information
Catalog #
Size
Price
Description
Apurinic/apyrimidinic (AP) sites occur frequently in DNA molecules by spontaneous hydrolysis, by DNA damaging agents or by DNA glycosylases that remove specific abnormal bases. AP sites are pre-mutagenic lesions that can prevent normal DNA replication so the cell contains systems to identify and repair such sites. Class II AP endonucleases cleave the phosphodiester backbone 5' to the AP site. This gene encodes the major AP endonuclease in human cells. Splice variants have been found for this gene; all encode the same protein.
Product Overview
Entrez GenelD
328
Aliases
APE; APX; APE1; APEN; APEX; HAP1; REF1
Clone#
7A2G7
Host / Isotype
Mouse / IgG1
Species Reactivity
Human, Monkey, Rat
Immunogen
Purified recombinant fragment of human APEX1 (AA: 219-318) expressed in E. Coli.
Formulation
Purified antibody in PBS with 0.05% sodium azide
Storage
Store at 4°C short term. Aliquot and store at -20°C long term. Avoid freeze/thaw cycles.
Product Applications
WB (Western Blot)
1/500 - 1/2000
IHC_P(Immunohistochemistry)
1/200 - 1/1000
FCM (Flow Cytometry)
1/200 - 1/400
ELISA
1/10000
References
1.Mutat Res Genet Toxicol Environ Mutagen. 2015 Nov;793:19-29.
2.PLoS One. 2015 Dec 1;10(12):e0143289.
2.PLoS One. 2015 Dec 1;10(12):e0143289.
Product Image
Elisa

Figure 1: Black line: Control Antigen (100 ng);Purple line: Antigen (10ng); Blue line: Antigen (50 ng); Red line:Antigen (100 ng)
Western Blot

Figure 2:Western blot analysis using APEX1 mAb against human APEX1 (AA: 219-318) recombinant protein. (Expected MW is 37.4 kDa)
Western Blot
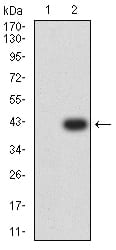
Figure 3:Western blot analysis using APEX1 mAb against HEK293 (1) and APEX1 (AA: 219-318)-hIgGFc transfected HEK293 (2) cell lysate.
Western Blot

Figure 4:Western blot analysis using APEX1 mouse mAb against Hela (1), Jurkat (2), SW480 (3), A431 (4), HepG2 (5), NIH/3T3 (6), and PC-12 (7) cell lysate.
Flow cytometric

Figure 5:Flow cytometric analysis of HeLa cells using APEX1 mouse mAb (green) and negative control (red).
Flow cytometric

Figure 6:Flow cytometric analysis of SK-N-SH cells using APEX1 mouse mAb (green) and negative control (red).
Immunohistochemical analysis

Figure 7:Immunohistochemical analysis of paraffin-embedded breast cancer tissues using APEX1 mouse mAb with DAB staining.
Immunohistochemical analysis

Figure 8:Immunohistochemical analysis of paraffin-embedded esophageal cancer tissues using APEX1 mouse mAb with DAB staining.
For Research Use Only. Not for use in diagnostic procedures.