
ADAP1 Primary Antibody
Item Information
Catalog #
Size
Price
Description
ADAP1 (ArfGAP With Dual PH Domains 1) is a Protein Coding gene. Among its related pathways are Class I PI3K signaling events and B Cell Receptor Signaling Pathway (sino). GO annotations related to this gene include GTPase activator activity and inositol 1,3,4,5 tetrakisphosphate binding. An important paralog of this gene is ADAP2.
Product Overview
Entrez GenelD
11033
Aliases
GCS1L; CENTA1; P42ip4
Clone#
3E2D9
Host / Isotype
Mouse / IgG1
Species Reactivity
Human, Rat
Immunogen
Purified recombinant fragment of human ADAP1 (AA: 240-370) expressed in E. Coli.
Formulation
Purified antibody in PBS with 0.05% sodium azide
Storage
Store at 4°C short term. Aliquot and store at -20°C long term. Avoid freeze/thaw cycles.
Product Applications
WB (Western Blot)
1/500 - 1/2000
FCM (Flow Cytometry)
1/200 - 1/400
ELISA
1/10000
References
1.Biol Chem. 2014 Nov 1;395(11):1321-40.
2.Neurochem Int. 2011 Nov;59(6):936-44.
2.Neurochem Int. 2011 Nov;59(6):936-44.
Product Image
Elisa

Figure 1: Black line: Control Antigen (100 ng);Purple line: Antigen (10ng); Blue line: Antigen (50 ng); Red line:Antigen (100 ng)
Western Blot

Figure 2:Western blot analysis using ADAP1 mAb against human ADAP1 (AA: 240-370) recombinant protein. (Expected MW is 41.6 kDa)
Western Blot

Figure 3:Western blot analysis using ADAP1 mAb against HEK293 (1) and ADAP1 (AA: 240-370)-hIgGFc transfected HEK293 (2) cell lysate.
Western Blot
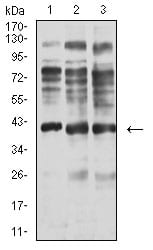
Figure 4:Western blot analysis using ADAP1 mouse mAb against C6 (1), A549 (2), and HepG2 (3) cell lysate.
Flow cytometric

Figure 5:Flow cytometric analysis of K562 cells using ADAP1 mouse mAb (green) and negative control (red).
For Research Use Only. Not for use in diagnostic procedures.