

CD179A Primary Antibody
Item Information
Catalog #
Size
Price
Description
The protein encoded by this gene belongs to the immunoglobulin superfamily and is expressed selectively at the early stages of B cell development, namely, in proB and early preB cells. This gene encodes the iota polypeptide chain that is associated with the Ig-mu chain to form a molecular complex which is expressed on the surface of pre-B cells. The complex is thought to regulate Ig gene rearrangements in the early steps of B-cell differentiation. Alternative splicing results in multiple transcript variants.
Product Overview
Entrez GenelD
7441
Aliases
VPREB1; IGI; IGVPB; VPREB
Clone#
5F8F3
Host / Isotype
Mouse / IgG1
Species Reactivity
Human
Immunogen
Purified recombinant fragment of human CD179A (AA: extra 20-145) expressed in E. Coli.
Formulation
Purified antibody in PBS with 0.05% sodium azide
Storage
4°C; -20°C for long term storage
Product Applications
WB (Western Blot)
1/500 - 1/2000
FCM (Flow Cytometry)
1/200 - 1/400
ELISA
1/10000
References
1.Leukemia. 2014 Jan;28(1):216-20.
2.Mol Immunol. 2011 Jun;48(11):1338-43.
2.Mol Immunol. 2011 Jun;48(11):1338-43.
Product Image
Elisa
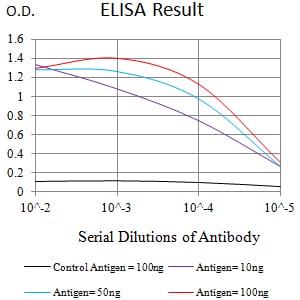
Figure 1:Black line: Control Antigen (100 ng);Purple line: Antigen (10ng); Blue line: Antigen (50 ng); Red line:Antigen (100 ng)
Western Blot

Figure 2:Western blot analysis using CD179A mAb against human CD179A (AA: extra 20-145) recombinant protein. (Expected MW is 40.5 kDa)
Western Blot

Figure 3:Western blot analysis using CD179A mAb against HEK293 (1) and CD179A (AA: extra 20-145)-hIgGFc transfected HEK293 (2) cell lysate.
Flow cytometric

Figure 4:Flow cytometric analysis of MOLT4 cells using CD179A mouse mAb (green) and negative control (red).
For Research Use Only. Not for use in diagnostic procedures.