
TLT2 Primary Antibody
Item Information
Catalog #
Size
Price
Description
TREML2 is located in a gene cluster on chromosome 6 with the single Ig variable (IgV) domain activating receptors TREM1 (MIM 605085) and TREM2 (MIM 605086), but it has distinct structural and functional properties.
Product Overview
Entrez GenelD
79865
Aliases
TLT2; TLT-2; C6orf76; dJ238O23.1
Clone#
4F9D2
Host / Isotype
Mouse / Mouse IgG2a
Species Reactivity
Human
Immunogen
Purified recombinant fragment of human TLT2 (AA: extra 19-268) expressed in E. Coli.
Formulation
Purified antibody in PBS with 0.05% sodium azide
Storage
Store at 4°C short term. Aliquot and store at -20°C long term. Avoid freeze/thaw cycles.
Product Applications
WB (Western Blot)
1/500 - 1/2000
IHC_P(Immunohistochemistry)
1/200 - 1/1000
ICC (Immunocytochemistry)
1/200 - 1/1000
FCM (Flow Cytometry)
1/200 - 1/400
ELISA
1/10000
References
1,Brain Behav. 2020 Apr;10(4):e01573.
2,Front Immunol. 2020 Sep 11;11:2031.
2,Front Immunol. 2020 Sep 11;11:2031.
Product Image
Elisa
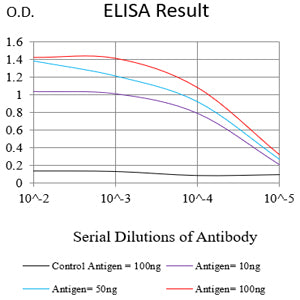
Figure 1:Black line: Control Antigen (100 ng);Purple line: Antigen (10ng); Blue line: Antigen (50 ng); Red line:Antigen (100 ng)
Western Blot

Figure 2:Western blot analysis using TLT2 mAb against human TLT2 (AA: 19-268) recombinant protein. (Expected MW is 30 kDa)
Western Blot

Figure 3:Western blot analysis using TLT2 mAb against HEK293-6e (1) and TLT2 (AA: 19-268)-hIgGFc transfected HEK293-6e (2) cell lysate.
Immunohistochemical analysis

Figure 4:Immunofluorescence analysis of Hela cells using TLT2 mouse mAb (green). Blue: DRAQ5 fluorescent DNA dye. Red: Actin filaments have been labeled with Alexa Fluor- 555 phalloidin. Secondary antibody from Fisher (Cat#: 35503)
Immunofluorescence analysis

Figure 5:Flow cytometric analysis of HEK293 cells using TLT2 mouse mAb (green) and negative control (red).
Immunohistochemical analysis
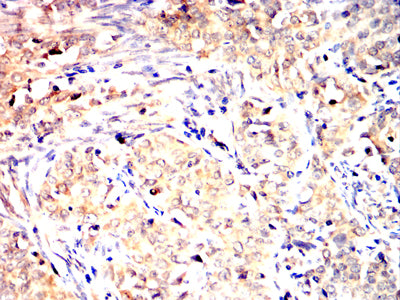
Figure 6:Immunohistochemical analysis of paraffin-embedded cervical cancer tissues using TLT2 mouse mAb with DAB staining.
Immunohistochemical analysis

Figure 7:Immunohistochemical analysis of paraffin-embedded rectum cancer tissues using TLT2 mouse mAb with DAB staining.
For Research Use Only. Not for use in diagnostic procedures.